Autumn property bounce meets cautious reality

Asking prices have rebounded after a subdued summer, but official sales data suggest London’s housing market remains finely balanced.
London’s property market has produced an intriguing autumn bounce. According to the latest Rightmove House Price Index, the average asking price of a newly listed London home rose 2.5% in October to £673,942, the strongest monthly increase in Great Britain. Yet asking prices remain 1.7% lower than a year ago.
The rebound follows an unusually weak summer. Rightmove reports that London asking prices fell by a combined 6% across July and August, while Inner London led October’s recovery with a 3.9% monthly increase.
For sellers, however, the distinction between asking and transaction prices is important.
What are London homes actually selling for?
The latest official figures give a more measured picture.
According to the Office for National Statistics (ONS), London property prices fell by 2.2% in the 12 months to August 2026, making the capital the weakest-performing English region for annual house-price growth. The official UK House Price Index puts the average London property price at approximately £554,000, although prices increased by 0.7% between July and August. The latest estimates are provisional and subject to revision.
Flats have played a significant part in that annual decline. The ONS reports that average London flat prices fell 5.0% year on year. By contrast, average prices across London’s detached, semi-detached and terraced houses all increased over the same period. Flats account for around half of property sales in London, compared with roughly a fifth across Great Britain.
This helps explain why the capital can experience a marked recovery in new asking prices while official transaction-price data remain negative over the year. The two measures capture different stages of the housing market: Rightmove tracks the asking prices of properties coming to market, while the UK House Price Index reflects completed transactions.
| Feature - scroll to continue with content... |


| continue reading article... |
London is far from one market
Capital-wide averages also disguise substantial local variation.
Rightmove’s three-month borough data puts the average new-seller asking price in Kensington and Chelsea at £1,507,185, down 4.8% annually, while Merton stands at £709,282, up 2.3%. In neighbouring Kingston upon Thames, the average is £669,190, down 2.2% year on year. However, it cautions that these borough figures are rolling three-month averages and are not directly comparable with its overall monthly London measure.
For buyers and sellers in south-west London, the variation is a reminder that conditions can differ considerably even between neighbouring boroughs.
Buyers remain price-conscious
Higher borrowing costs remain an important part of the picture. Rightmove puts the average two-year fixed mortgage rate at 5.55%, up from 5.29% a month earlier, and estimates that the monthly cost of a typical new mortgage has risen by around £250 since February.
There are also signs of a more demanding environment for London sellers. According to Rightmove, 38% of London listings are being reduced, homes take an average 78 days to find a buyer, and 42% successfully secure one.
Across Great Britain, sales being agreed are 8% lower than a year ago, while new potential buyers contacting agents are down 9% and new listings are 3% higher.
A market rediscovering its price
The latest figures therefore deserve neither exuberance nor pessimism.
London’s October rebound shows that new-seller asking prices have recovered some of the ground lost over the summer. Official transaction data, however, remain more subdued, while higher mortgage costs continue to influence affordability.
For sellers, the figures underline the importance of considering current local market conditions when setting an asking price. For buyers, greater choice and lower year-on-year average transaction prices across London may present opportunities, although borrowing costs remain an important consideration.
For now, London appears to be rediscovering its price rather than entering a broad-based property revival. In a capital made up of highly distinctive local markets, what is happening borough by borough, neighbourhood by neighbourhood and street by street may ultimately prove more useful than the headline London figure alone.
| Feature - scroll to continue with content... |


| continue reading article... |
London feels the pressure
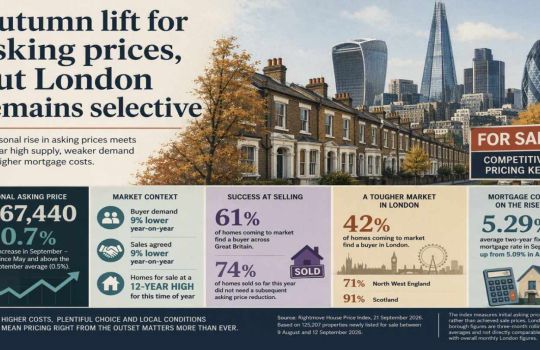
Conditions appear particularly testing in the capital, where only 42 per cent of homes coming to market find a buyer. That compares with 71 per cent in North West England and 91 per cent in Scotland.
London itself presents a varied picture. Rightmove’s borough data records annual asking-price growth of 2.4 per cent in Haringey and 0.8 per cent in Richmond upon Thames. Elsewhere, asking prices were 5.8 per cent lower in Wandsworth, 5.6 per cent lower in Barnet, 6 per cent lower in Camden and 5.3 per cent lower in Kensington and Chelsea. The borough figures are three-month rolling averages and are not directly comparable with Rightmove’s overall monthly London figures.
Borrowing costs provide a further constraint. The average two-year fixed mortgage rate cited in the index rose from 5.09 per cent to 5.29 per cent, maintaining pressure on household affordability.
September’s increase therefore offers some encouragement without fundamentally altering the character of the market. For sellers, initial pricing and presentation assume greater importance when purchasers can afford to be discriminating. For buyers, increased choice may provide greater scope for negotiation, but financing costs continue to limit purchasing power.
The autumn market may be stirring, but in London especially, the national headline conceals a more fragmented picture. The balance increasingly turns on the merits, pricing and location of the individual property rather than the direction of the wider market.
Sources & Bibliography:
Rightmove House Price Index, October 2026
Published 19 October 2026. Asking-price and market-activity data.
https://www.rightmove.co.uk/news/house-price-index/
October 2026 House Price Index PDF:
https://www.rightmove.co.uk/news/content/uploads/2026/10/Rightmove-HPI-19th-October-Final-NE.pdf
Office for National Statistics – Private rent and house prices, UK: October 2026
Published 21 October 2026. Includes the latest August 2026 house-price figures.
https://www.ons.gov.uk/economy/inflationandpriceindices/bulletins/privaterentandhousepricesuk/october2026
HM Land Registry – UK House Price Index for August 2026
Published 21 October 2026. Includes London, regional and property-type statistics.
https://www.gov.uk/government/news/uk-house-price-index-for-august-2026
UK House Price Index Summary: August 2026
Accredited official statistics, published 21 October 2026.
https://www.gov.uk/government/statistics/uk-house-price-index-for-august-2026/uk-house-price-index-summary-august-2026
This article is for informational purposes. Always seek professional advice before making any property or financial decisions. The views expressed in this article are opinion-based commentary intended to explore potential market outcomes. Housing market performance is influenced by a wide range of factors including interest rates, mortgage availability, economic growth, employment levels, taxation, housing supply, and consumer confidence. Actual market developments may differ from the scenarios discussed. Always seek professional advice before making any property or financial decisions.